TODO
General Goals
We hope to build a module which can be convenient to visualize financial data.
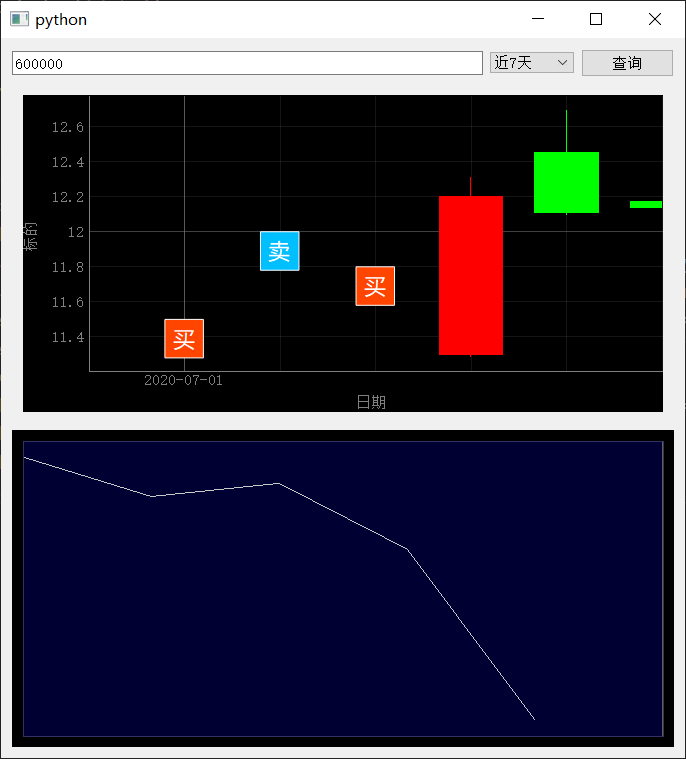
After importing the module, a user can add the canvas as a widget to a Qt window. There are multiple plots to be inserted into the canvas. The plots can have bird-eye-views for more convenient interactions. Several plots can be ganged with each other in order to visualize the same data. There are three basic graphic types: Candle, Curve, Bar. Different diagram can be drawn with the same figure, or they can drawn with different figure that shares the same x- or y-axis. The target graph is shown below. In addition, the style of graph can be identifed by external json file. When there are some specified requirement, e.g. visualzie the buying/selling cases in the graph, it should be convenient to extend to satisfied that. To achieve that, figure (or canvas) should be seperated with plot. Bird-Eye-View is a individual tool that can be combined with any figure. To visualize some text, e.g. parameter setting texts, we should realize a text-board, so that we can edit parameters throught that.
To conclude, we make a brief list to indicate the required features which our module should have:
- style setting,
- basic plot types,
- extensible plot,
- multi-plots with a same figure
- figure-plot seperation,
- linkage beteen plots,
- plot-irrelavent bird-eye-view, and
- text board.
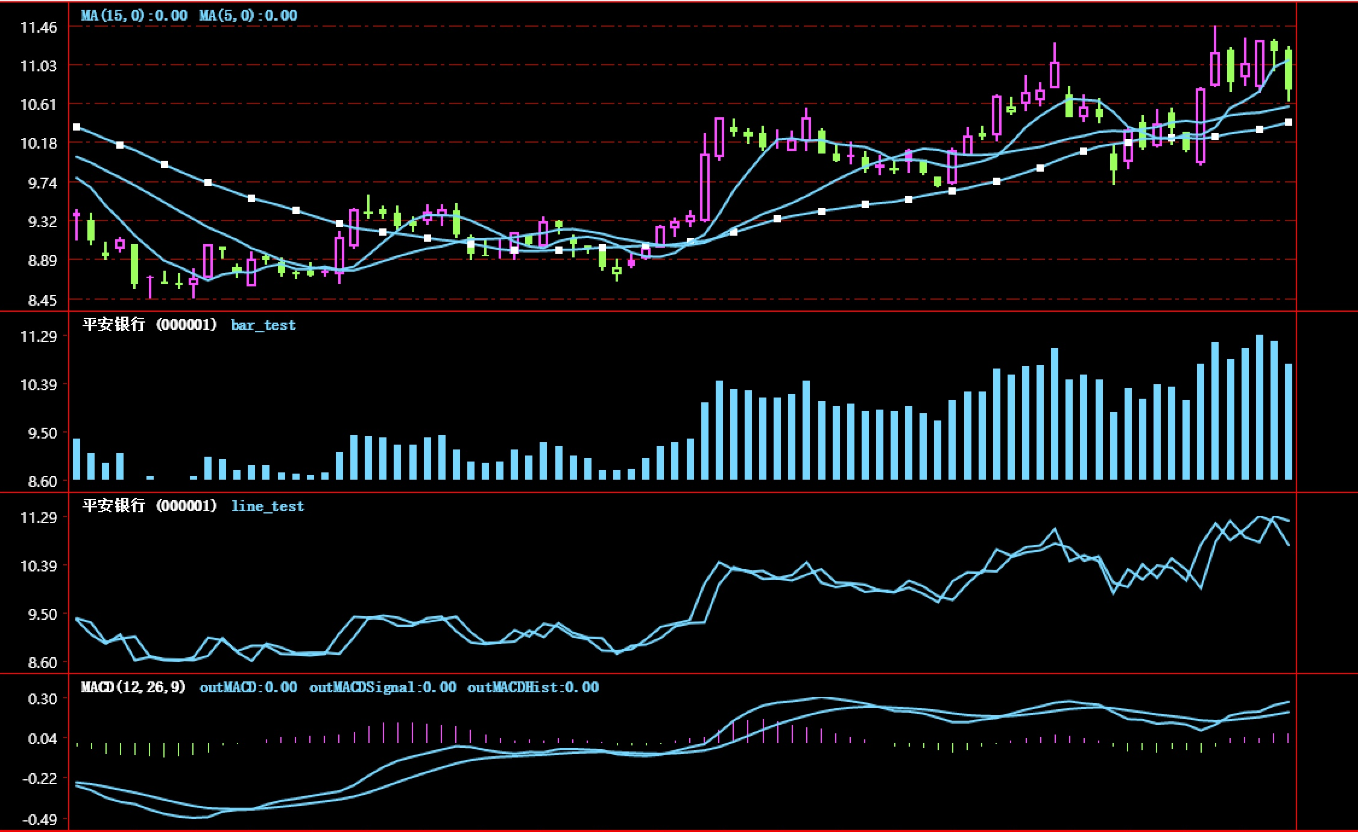 target graph
Fig. 1 The target graph hoped to generate.
target graph
Fig. 1 The target graph hoped to generate.
TODO List
Visualization
- [x] to show the bird’s eye view of the k-line canvas.
- [x] to show a rectangle whose position can be set by mouse click.
- [x] to move the view of k-line canvas via the click at some posisiton in bird’s eye view.
- [ ] to seperate large data to multiple hdf5 files, read it and then show it. When visualize tick data, this machenism is needed.
- [ ] seperate plotting method and plotting canvas.
- [ ] different graph can be plotted in the same canvas.
- [ ] several graphs are ganged with each other.
- [ ] several graphs are ganged with the same bird-eye-view.
- [ ] to customize the style and attribute of the label in the plot.
- [x] to fill in some color fade under or over the curve.
- [x] can fill in gradient color under the cueve.
- [x] can fill in gradient color over the cueve.
- [x] to draw multi-curves in the same canvas.
- [x] the curves should not be covered by filled-in color when they are in the same canvas.
- [ ] support text borad in which some texts or variable values are shown.
- [x] hide the crossline when the mouse is not moving on the graph.
- [x] seperate figure and plot.
- [x] hide cross-line when the mouse is out of the figure.
- [x] overlay multiple plots.
- [x] eliminate multi-axes conflicts. when there are several graphs plotted in the same figure, the axes of different plots may differ from each other. how to handle it?
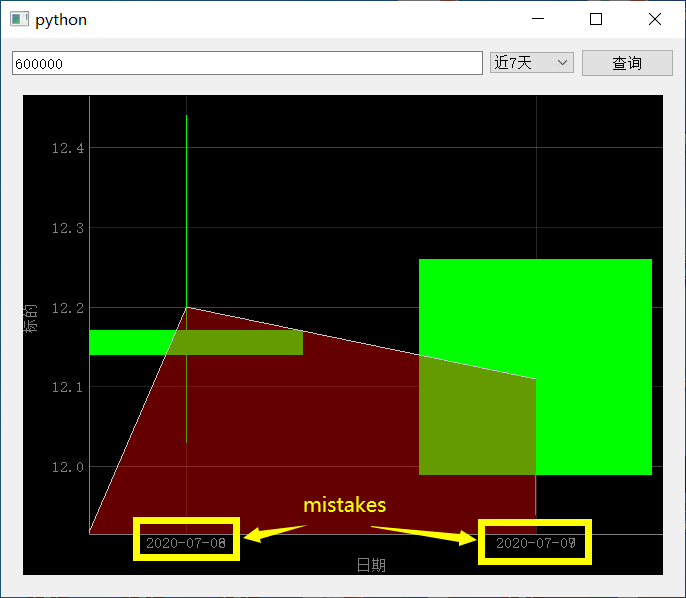 mistaken_case_2
 - [x] when data in some days is missing, the curve should be retain blanked. how to handle it?
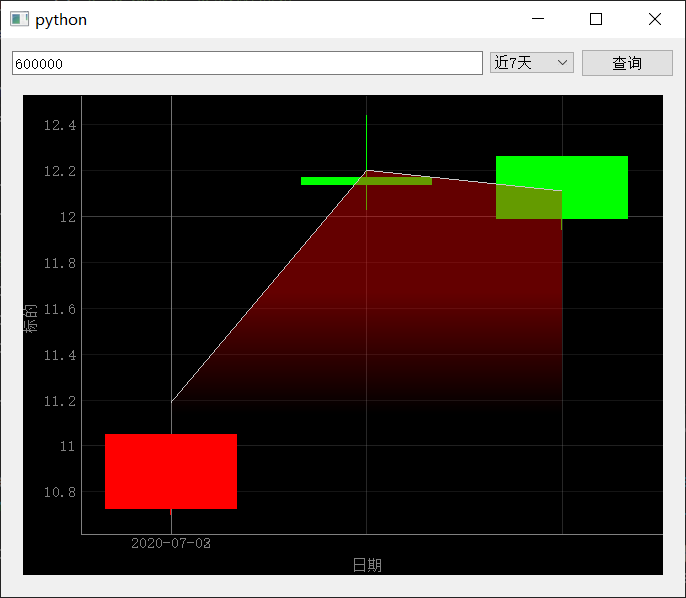 mistaken_case_1
finally, we fill the missing data with nan, and tune the plot to be compatible with data including nan. the performance is shown below.
mistaken_case_1
finally, we fill the missing data with nan, and tune the plot to be compatible with data including nan. the performance is shown below.
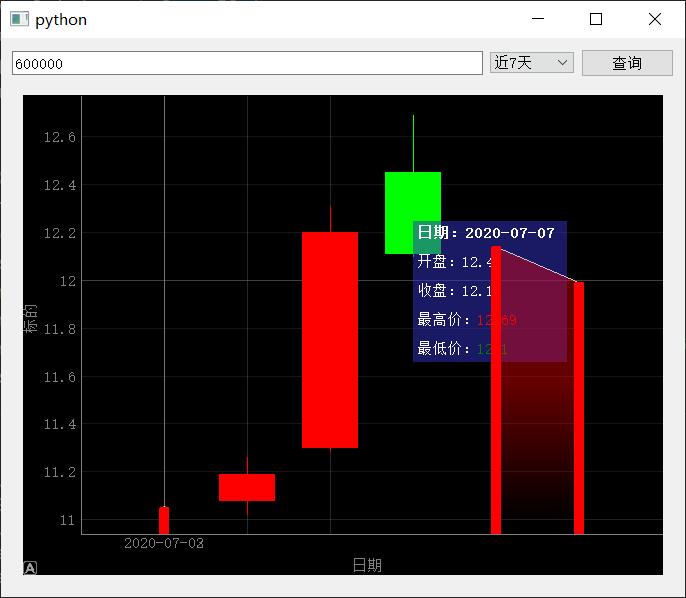 fix_multiple_plots
 - [x] the plots may cover each other. how to manage the zvalue? (specifically, the curve should be the topmost but the filled area below it should be bottommost with regard to candle and bar.)
- [x] eliminate multi-axes conflicts. when there are several graphs plotted in the same figure, the axes of different plots may differ from each other. how to handle it?
- [ ] show trading history in any figure.
- [x] show the label of trading history.
- [ ] fill missing data with nan is not a wise way. because trading history data is highly sparse, there is no necessity to fill them with large amount of useless information. we can use a look-up-table to convert index between original index of data and filled index, so that some distinct space and time costs can be saved.
- [ ] change the size of
TextItemin some limit.
- [ ] show bird-eye-view in some figure.
- [ ] linkage between figures.
- [ ] refresh plots dynamically
- [ ] read big data (maybe a 200MB file).
- [ ] fix bug.
 bug_case_20200713_1
 - [ ] show the content of figure into the bird-eye-view.
- [ ] show the bird-eye-view when the data lengths of figure and bird-eye-view are different.